IRT Resupply Algorithms Explained: Which One Fits Your Clinical Supply Chain?
When it comes to optimizing your clinical trial’s supply chain, the resupply algorithm running inside your IRT (Interactive Response Technology) or RTSM (Randomization and Trial Supply Management) system is one of the most consequential choices you’ll make.
Yet many clinical supply managers inherit their resupply algorithm without fully understanding its mechanics, or whether it’s the right fit for their trial. In this article, we explain the main types of RTSM resupply algorithms, when each one works best, and how clinical supply forecasting and optimization software can help you make a more informed choice.
Why Commercial Supply Chain Algorithms Don’t Work in the Clinical Supply Chain
In the commercial supply chain, there are many well-established resupply solutions for pharma and other industries. But these commercial solutions differ greatly from what works in clinical supply, for several important reasons.
Firstly, service levels in clinical supply are extremely high. In a commercial supply chain, some degree of stock-outs is acceptable: a pharmacy might run out of a product temporarily and restock within days. In clinical supply, keeping sites supplied is critical to keeping trials going and patients safe. A stock-out at a clinical trial site can mean a patient misses a dose, which has direct implications for patient safety and data integrity.
Second, clinical supply chains have little to no historical data, while commercial supply chains rely heavily on it. Commercial algorithms analyze trends over multiple years, months, or even hours to detect growth, seasonality, and the impact of external factors like weather or promotions. A clinical trial, by contrast, may be first-in-human with no prior demand data to draw from.
Third, commercial algorithms typically rely on restrictive assumptions such as a typical (often normal) distribution of demand. When dealing with the lower volumes of a clinical supply chain, greater uncertainty abounds, and the ability to pivot quickly becomes essential. A first batch of medicine may cover 100% of demand at sites, but it may not. That’s where planning for resupply comes in: accounting for packaging, labeling, depot loading, site inventory replacement, and more.
These differences make it clear: clinical trial resupply demands purpose-built logic, not off-the-shelf commercial supply chain formulas.
Why IRT/RTSM Is the Focal Point of Clinical Trial Resupply
IRT/RTSM has become the natural place to automate what would otherwise be a highly time-consuming, low-value task: manually managing shipments. Because the RTSM already handles randomization, blinding, and management of large inventories across depots and sites, it holds much of the essential real-time and historical data that informs resupply decisions.
Site Available Inventory (SAI) data within RTSM systems helps determine when new shipments are needed at each site. Essentially, RTSM systems help plan and automate orders so that supplies are available and patients do not miss doses during trials.
This is why, when we talk about resupply algorithms, we are really talking about the logic embedded in (or configured within) your RTSM platform.
Site Resupply KPIs
To compare algorithms or configurations rationally, we need to consider Key Performance Indicators. In this context, two major KPIs are particularly helpful. The first is the estimated risk level, the probability of missing patient dispensings because of a site stock-out. Patient safety comes first. The second is the overall site supply cost, which includes waste or overage, the number of site shipments required, and other factors such as cost of site inventory, returns, and destructions.
The selection of an algorithm (or RTSM vendor), its configuration, and reviewing this configuration periodically as the study progresses are all critical to driving these KPIs down: ideally achieving a very low risk level (or very high service level) for a reasonable overall cost.
It is worth noting that often you do not get to choose the algorithm itself. An RTSM vendor will typically offer one or a small number of options. What you can control is how you configure the parameters within that algorithm, and whether you supplement it with external forecasting and optimization tools to test those configurations before going live or during the study.
Understanding Site-Level Demand: Why Resupply Is Hard
Before diving into the algorithms themselves, it helps to understand what demand actually looks like at a clinical trial site, because this is what any resupply algorithm is trying to anticipate.
Consider a site with three patients, each enrolled at different times. Each patient has weekly visits where they receive drug kits. The standard dose is 2 kits per visit, but patients can titrate up (to 4 kits) or down (to 1 kit) at any visit depending on their response to treatment. After approximately 6 visits, a patient’s dose typically stabilizes and their demand becomes predictable.
This creates three distinct components of demand at every site:
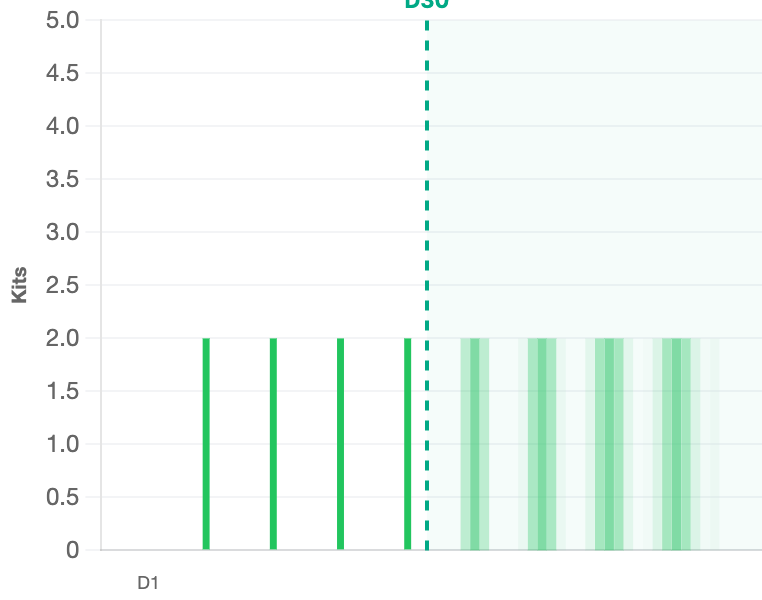
Predictable Demand (PD) comes from patients who have been in the trial long enough that their dose is stable and their visit schedule is well established. For these patients, the RTSM knows exactly when they will come in and how many kits they should need. This is the easiest demand to plan for.
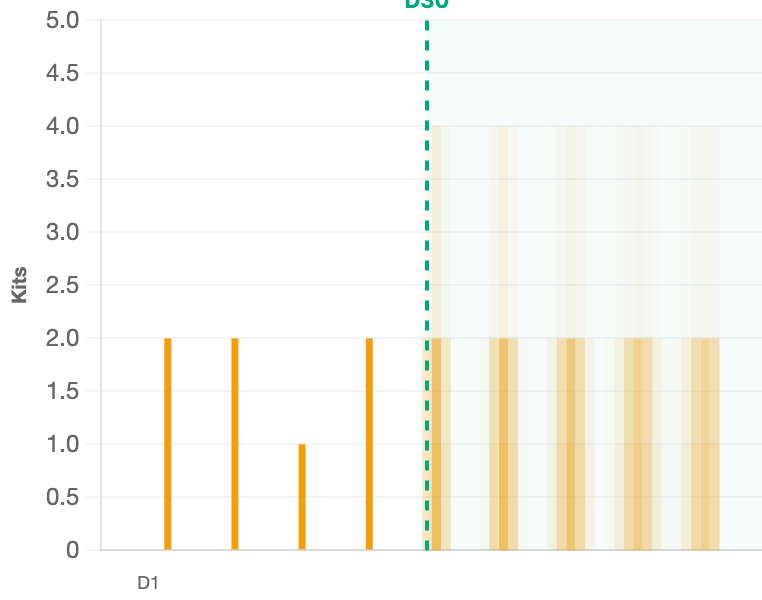
Correlated Unpredictable Demand (CUD) comes from patients who are enrolled and have scheduled visits, but who could titrate at any future visit. The algorithm knows when they will visit and uses the latest dose as a prediction, but the actual quantity is drawn from a probability distribution. For example, if a patient can receive 1, 2, or 4 kits per visit (with probabilities of 25%, 50%, and 25% respectively), the expected demand is 2.25 kits per visit, but any single visit could be anywhere from 1 to 4. This is the trickiest component: it is partially predictable (the visit will happen, and the latest dose is the best guess) but genuinely uncertain (the dose may change at the next visit due to titration).
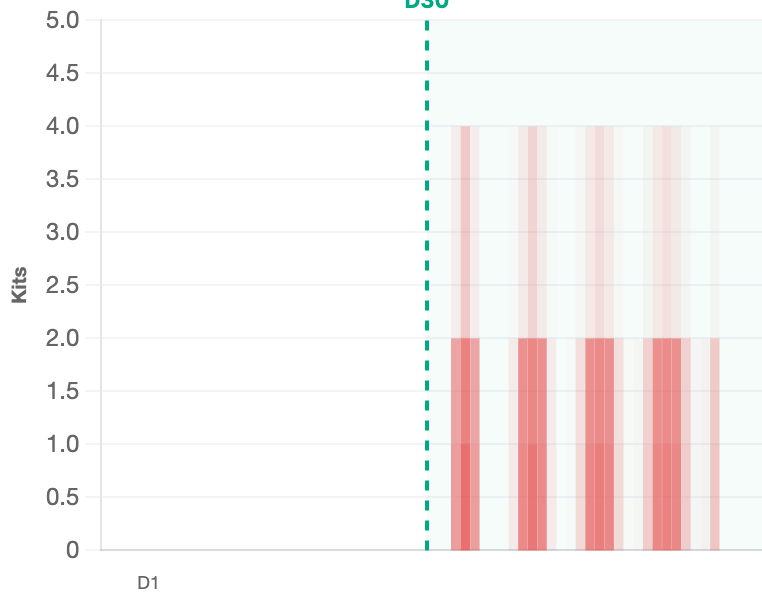
Uncorrelated Unpredictable Demand (UUD) is truly random demand with no predictable pattern. The most significant source of UUD is new patient enrollments: a site might gain one or several new patients at any time, each needing an initial supply of kits. Other UUD events include unscheduled visits and replacement kits needed due to damage or loss. There is no signal to forecast from; this is pure noise. For most standard algorithms, UUD is what the safety buffer must absorb.
The ratio of these three components shifts over the life of a trial. In early enrollment, most demand is CUD and UUD. As the trial matures and patients stabilize, PD grows and the overall demand becomes more predictable. This is precisely what the more sophisticated resupply algorithms try to exploit.
From Demand Signal to Stockout: What Happens Without Resupply?
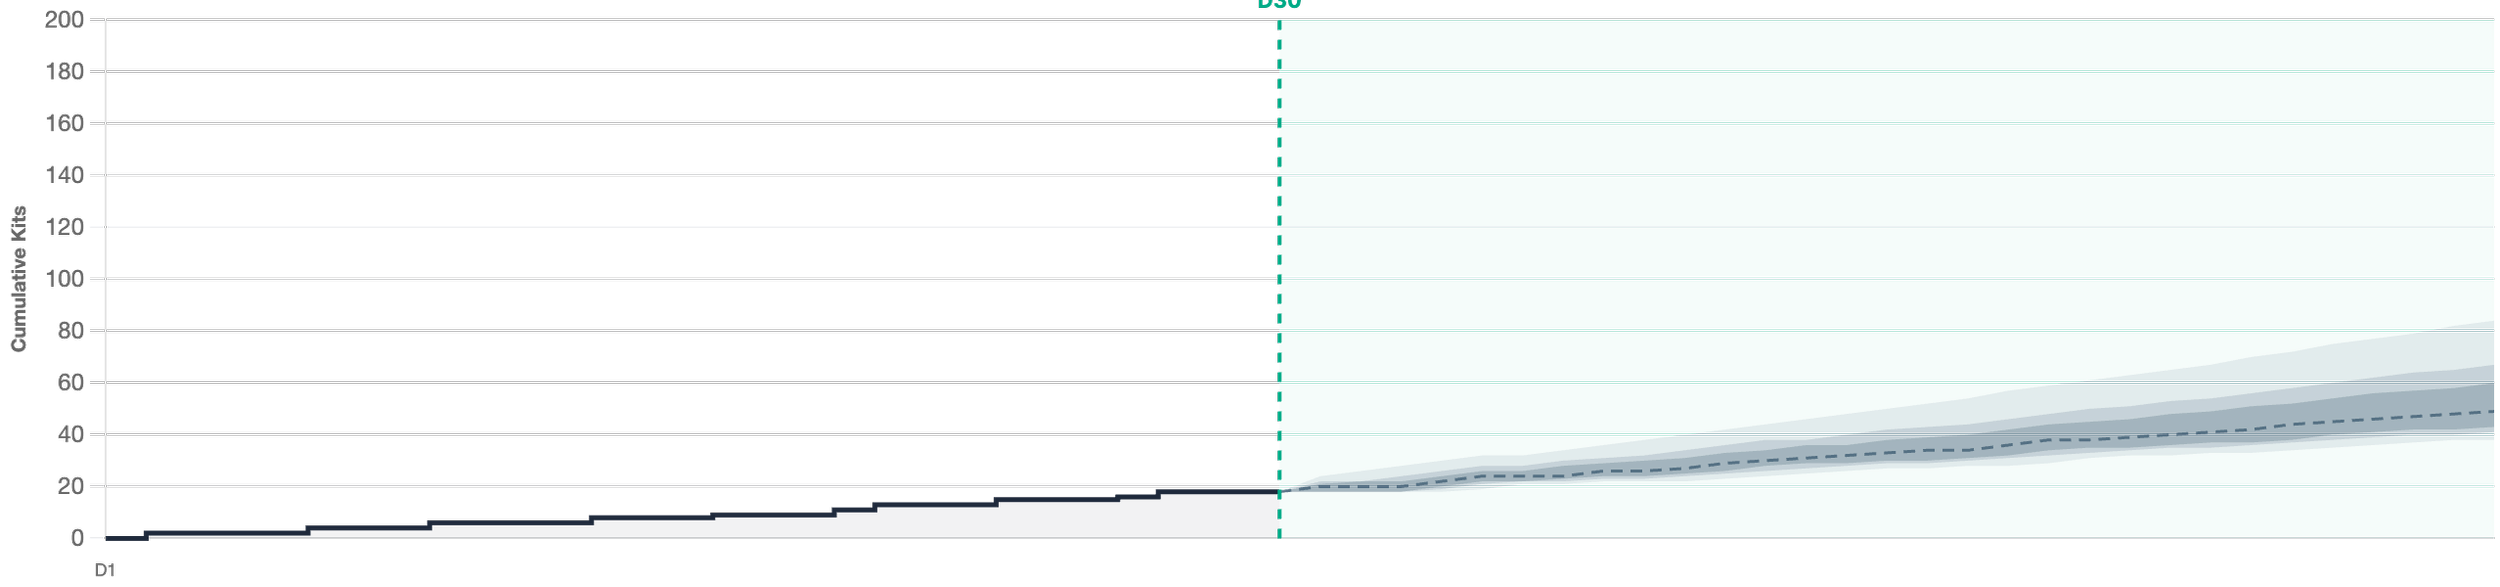
Once you understand the demand signal, the next question is immediate: how long does my current inventory last?
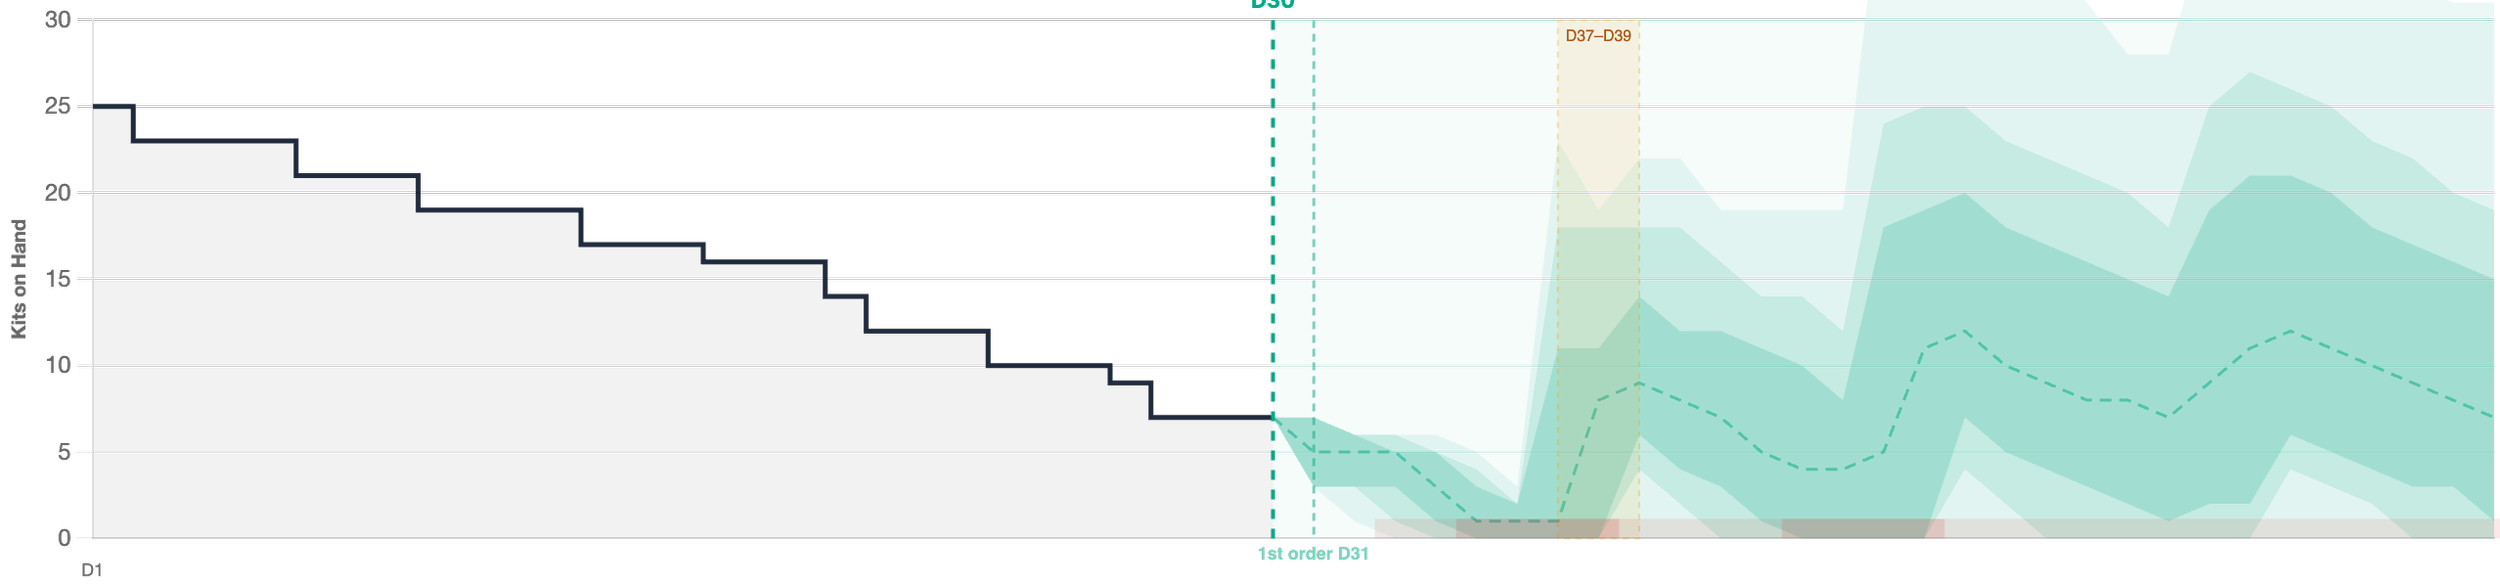
Starting from a known Site Available Inventory (SAI), we can project forward by subtracting the cumulative demand. But since future demand is uncertain, the inventory projection is not a single line. It is an expanding cone of possibilities. The expected inventory declines steadily, but the actual path could be steeper (if patients titrate up or new enrollments arrive faster than average) or shallower (if demand is lighter than expected). Eventually, every path hits zero. The question is when, and with what probability.
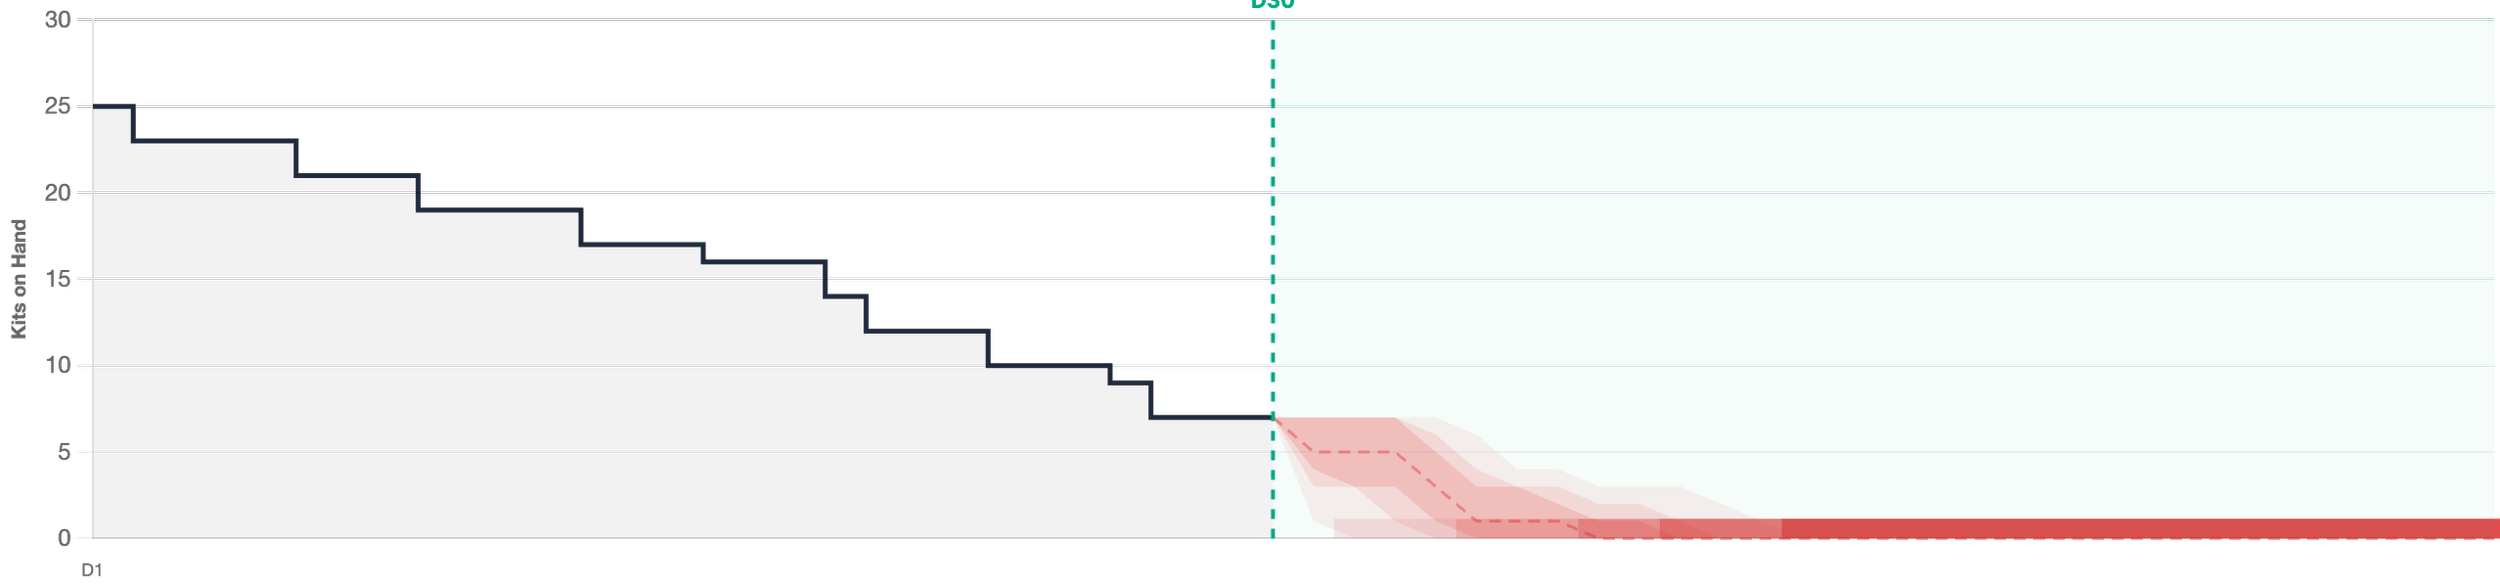
This is the core tension that every resupply algorithm must resolve: ship too early or too much, and you create waste and unnecessary shipments. Ship too late or too little, and you risk a stockout that directly impacts patient safety.
Try It Yourself: What Does It Cost to Eliminate Stockout Risk?
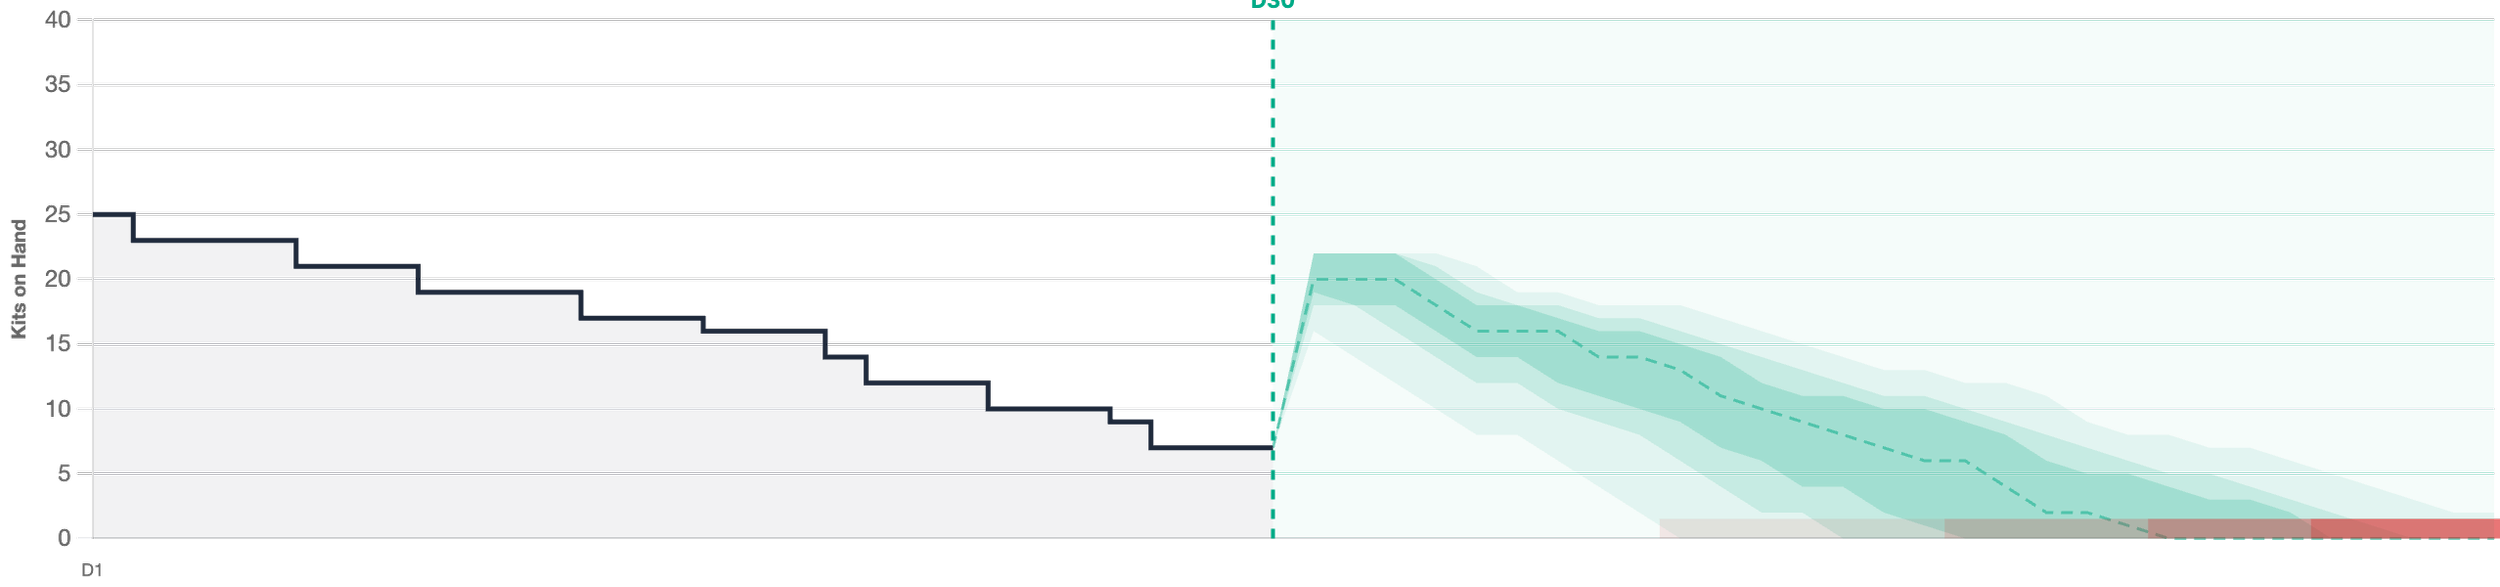
We built an interactive simulator that lets you explore exactly this tradeoff. Send a manual shipment and watch the inventory projection respond. Drag the prediction day slider, adjust uncertainty, change buffer parameters, and see in real time how each algorithm performs against the same patient demand.
→ Try the RTSM Resupply Simulator
The key insight visible immediately: eliminating stockout risk entirely (keeping even the 99.9% confidence band above zero at all times) requires significantly more inventory than keeping just the expected value above zero. This is the cost of safety, and it is exactly the tradeoff that resupply algorithms are designed to manage automatically.
Types of IRT/RTSM Resupply Algorithms
There is no one-size-fits-all resupply algorithm. Every trial’s characteristics are different, and there is no single configuration that guarantees simplicity and efficiency every time. As you will see, resupply algorithms and configurations have different benefits and drawbacks. Understanding what each one entails and why it is used can help you make better decisions, or at least ensure that you ask your RTSM vendor the right questions.
Min-Max: The Simplest RTSM Resupply Algorithm
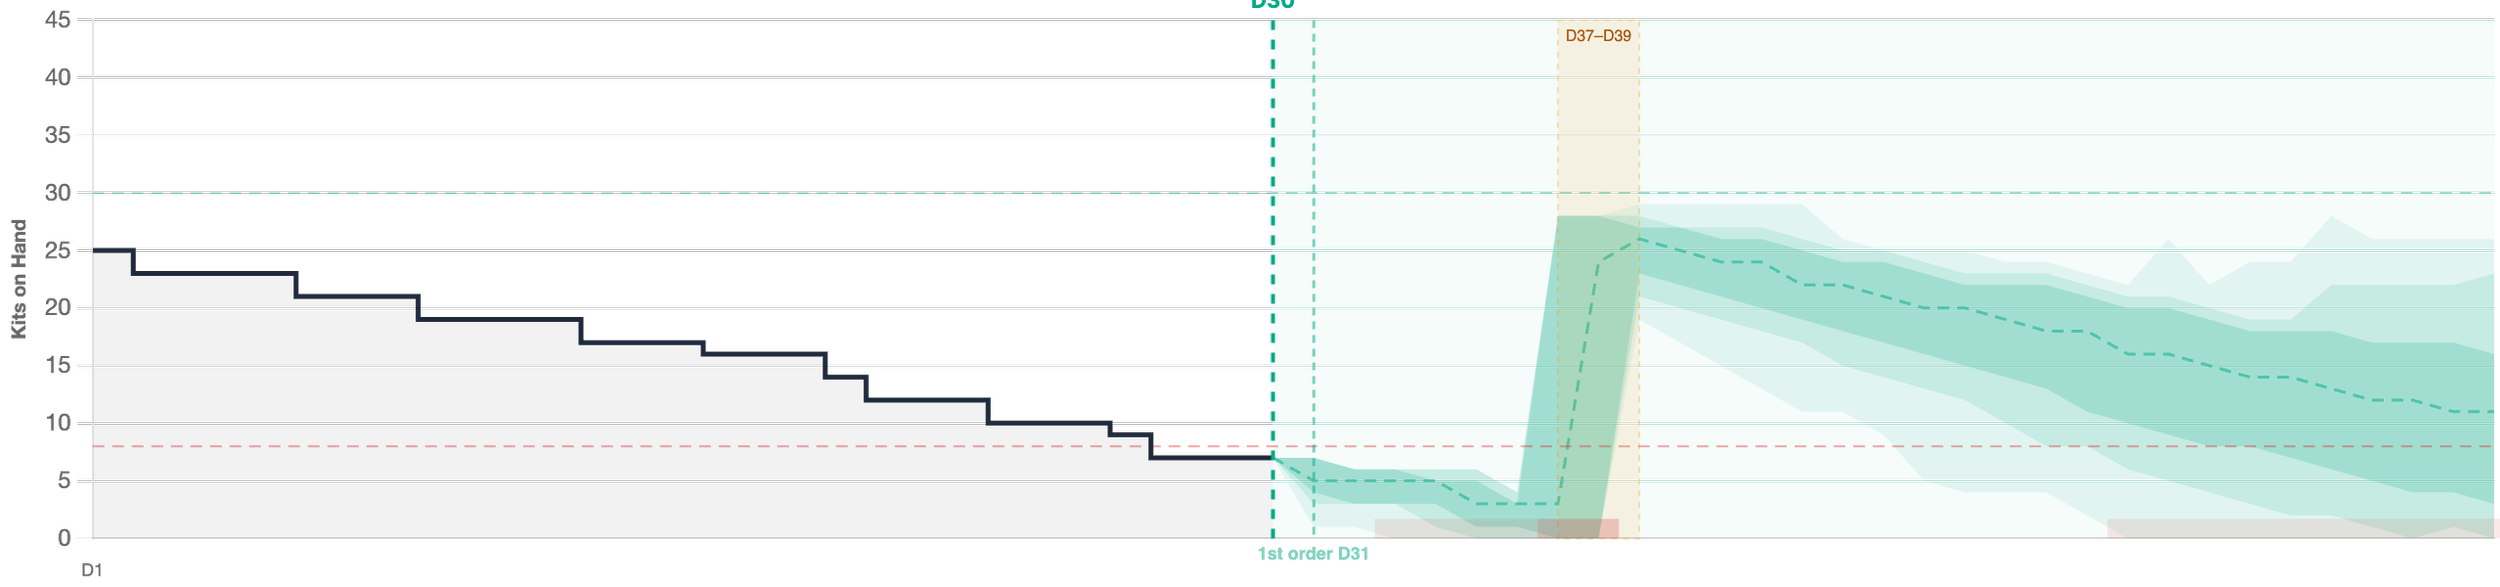
The min-max algorithm is the most basic resupply approach. It entails balancing the minimum and maximum amount of inventory at sites. When a site’s available inventory drops to (or below) a specified minimum number of drug kits, a shipment is automatically triggered to bring the site back up to its maximum level. This method is also widely used in the general supply chain as the “safety stock and re-order point” strategy.
For example, if a site’s minimum is set at 8 units and the maximum at 30, a shipment will be triggered when the site reaches 8 units or fewer in its site available inventory. That shipment quantity will be the number of units needed to bring the site back to its maximum of 30. If the site has 6 units remaining, 24 units will be shipped from a supply depot.
The min-max algorithm is straightforward and can perform well in certain types of studies: for example, when demand is highly unpredictable (ongoing enrollment, randomization, multiple dose levels with distinct dispensing units), or when volumes are low and drugs are cheap and abundant. However, it does require that the min and max levels are estimated with care and reviewed periodically to ensure good control over the risk of running out of stock, proper management of inventory in consideration of expiry dates and inventory replacement, and control over shipping frequency.
A few important properties of min-max to keep in mind: the value for “min” drives the risk (a higher min means more safety stock and a higher service level); the value for “max” (or more precisely, the difference between max and min) drives the shipping frequency; and the average shipping interval is approximately (max minus min) inventory divided by average daily demand.
Pure Predictive Resupply Algorithm
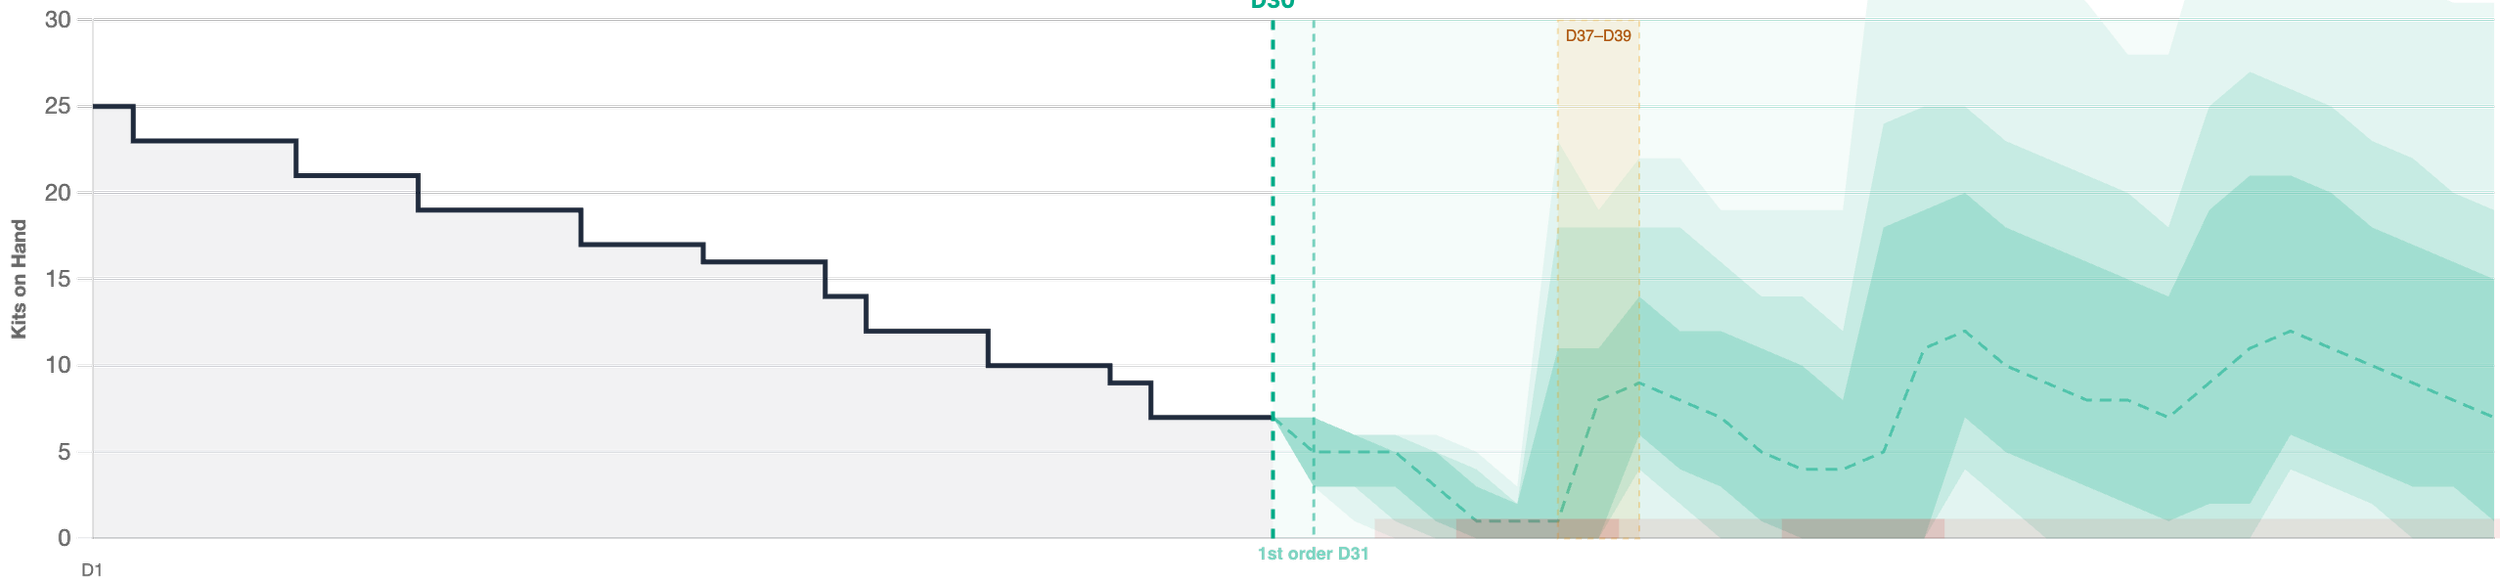
A pure predictive algorithm attempts to anticipate future demand at clinical trial sites using only predicted visit schedules and the latest known doses, with no fixed safety buffer. It orders precisely what it expects each site to need within a prediction window, and no more.
Predictive algorithms may use short prediction windows (a couple of days to a couple of weeks) to respond quickly to shifts in patient schedules and inventory consumption. This is common in trials where demand changes frequently, such as an oncology trial with phased dose escalation. Alternatively, they may use longer prediction windows spanning several weeks or months to account for seasonal enrollment fluctuations, plan bulk resupply shipments, set strategic inventory levels, or accommodate study milestones.
But with predictive resupply, the devil is often in the details. The algorithm predicts based on the latest known dose for each patient, but if a patient titrates (up or down) at their next visit, the actual demand will differ from the prediction. Without a buffer to absorb this CUD variability, a pure predictive system can find itself short when a patient unexpectedly up-titrates from 2 kits to 4. Short prediction windows require highly accurate, frequently updated data. Longer windows introduce more uncertainty. And the quality of predictions depends heavily on the granularity and accuracy of the inputs, including whether the system distinguishes between earliest vs. expected visit times, accounts for no-shows, or handles titrating patients differently from stable ones.
When it works well, particularly in trials where doses are fixed and patient visits are highly regular, a pure predictive approach can result in very tight inventory management, minimal waste, and efficient shipping. But it demands more data, more sophistication, and more ongoing attention than either min-max or hybrid configurations, and it carries a higher risk of near-stockout events when demand deviates from predictions.
Hybrid Model: The Most Commonly Used Resupply Algorithm Today
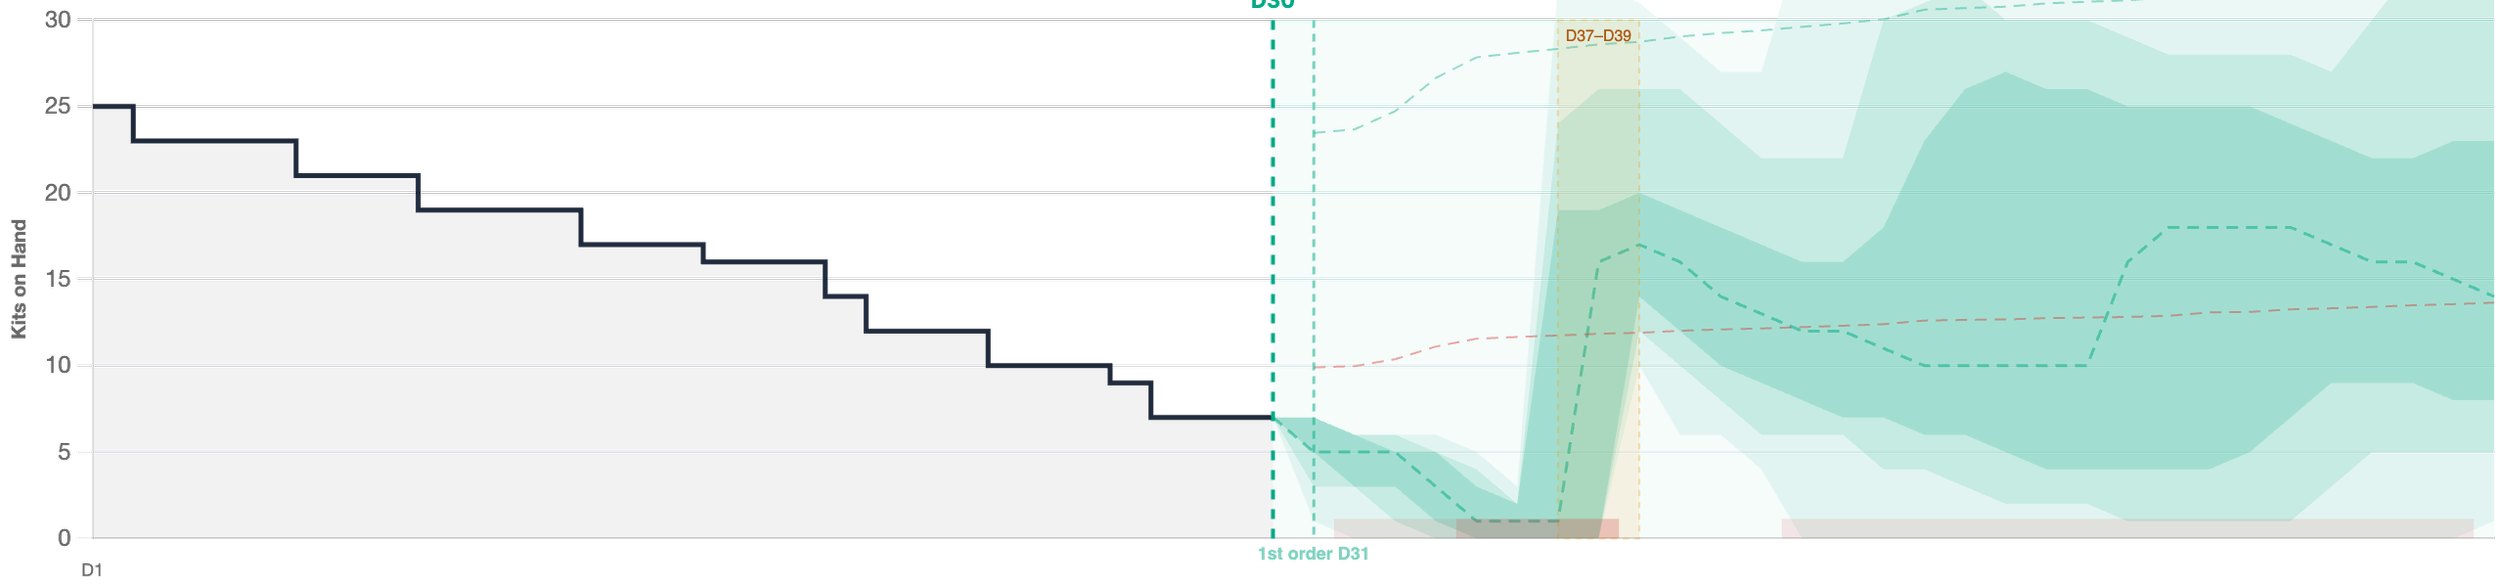
Currently, the hybrid model is broadly favored for its combination of a fixed safety buffer with predictive demand calculations. It is seen as more adaptive than min-max because it adjusts dynamically as patients enroll, titrate, and stabilize, while still maintaining a safety net for the demand it cannot predict.
The hybrid algorithm typically relies on five configurable parameters: an initial shipment quantity, a minimum and maximum buffer (in drug units), and a minimum and maximum weeks of supply.
The resupply logic works in two steps:
Step 1: Is an order needed? The system checks whether the current Site Available Inventory (SAI) has dropped below a dynamic threshold that combines the fixed buffer with predicted demand: IF SAI is less than Min Buffer plus Predicted Drug Need for Min Weeks of Supply, trigger an order.
The Predicted Drug Need is calculated by looking at all currently enrolled subjects at the site and their upcoming visits within the defined window. The system uses each patient’s latest known dose as the prediction, which is accurate for stable patients (PD) but may be off for titrating patients (CUD). This is exactly why the buffer exists: it covers the UUD (truly random demand) and the unpredictable portion of CUD (dose changes due to titration).
Step 2: How much to order? If a resupply is needed, the system calculates the order quantity to bring the site up to its maximum target: Order Quantity equals Max Buffer plus Predicted Drug Need for Max Weeks of Supply minus SAI.
The key insight is that the trigger and target levels are dynamic: they move as patients enroll (more predicted demand means higher threshold) and as patients complete or drop out (less predicted demand means lower threshold). This is fundamentally different from a static min-max, where the thresholds are fixed regardless of how many patients a site has.
For example, consider a site dispensing 2 kits per subject per week with 3 active subjects, a minimum buffer of 4 and minimum weeks of supply of 3. The minimum threshold would be 4 + (3 × 2 × 3) = 22 units. If a fourth patient enrolls, the threshold automatically rises to 4 + (4 × 2 × 3) = 28 units, no manual reconfiguration needed.
This hybrid approach is the most commonly implemented today across major RTSM providers, and it works well for a wide range of trial designs. The buffer parameters account for what the algorithm cannot predict (UUD and CUD variability), while the weeks-of-supply parameters leverage what it can (scheduled visits at the latest known dose).
Drug Expiry and DNC Events: When Inventory Disappears Without Being Dispensed
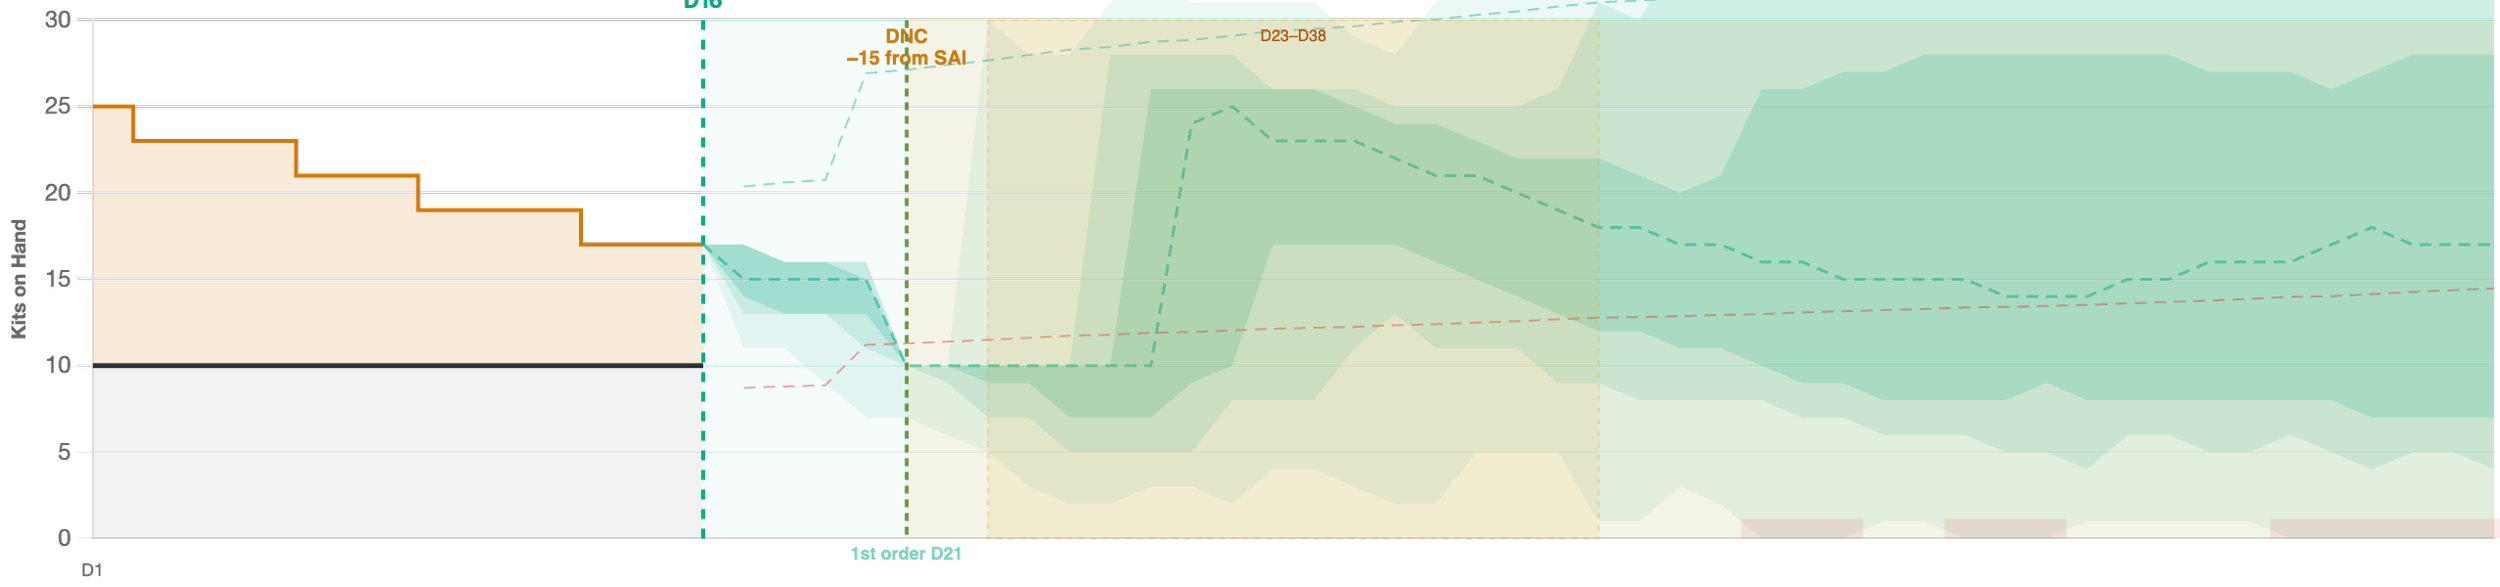
So far, we have focused on demand (patients consuming kits at visits) as the sole driver of inventory depletion. But there is another force that can drain a site’s available inventory: drug expiry.
When drug kits approach their expiration date, they are flagged with a Do-Not-Count (DNC) date. Once that date passes, those kits are no longer counted in the Site Available Inventory. From the resupply algorithm’s perspective, this looks like a sudden drop in SAI, even though no patient received the drug. If enough kits expire at once, this drop can push the site below its reorder threshold and trigger an unplanned shipment purely to replace the expired stock.
You can see the DNC event in action by adjusting the “DNC from expiry” control in our interactive simulator and watching how the inventory curve drops sharply, often triggering an additional resupply that would not have been needed otherwise. In scenarios where large batches of kits share the same expiry date (common when an initial shipment is sent at site activation), the DNC event can be severe enough to temporarily stockout the site before the replacement shipment arrives.
This has real cost implications. The extra shipment adds shipping, handling, and courier fees. The expired kits represent wasted drug product. And if the replacement shipment is delayed in transit, the site may not be able to dispense to patients on schedule, creating a risk to both the trial timeline and subject welfare.
Advanced Predictive Algorithms
The algorithms we have covered so far (min-max, pure predictive, and the hybrid/standard combined) are well-established, widely documented techniques. They represent the bulk of what is deployed across major RTSM systems today.
Some RTSM providers go further with proprietary predictive capabilities. These advanced algorithms may incorporate one or more of the following, depending on the vendor:
Enrollment forecasts: Rather than being blind to future enrollment, the algorithm incorporates the study’s planned enrollment curve per site. This allows it to pre-position inventory ahead of expected enrollment surges, shifting demand from the “unpredictable” bucket into the “predictable” one. The catch is that the forecast is only as good as the enrollment plan, and enrollment in clinical trials routinely deviates from projections.
Prediction matrices: Instead of using the patient’s latest dose as the sole prediction for future visits, some systems allow supply managers to define explicit prediction rules. For example: for a patient in titration phase on dose level 2, predict 3 kits for the short window and 4 kits for the long window. This can be specified exhaustively or on an override basis for specific patient states.
DNC-aware ordering: Advanced algorithms may look ahead and detect that DNC events are approaching within the prediction window. Rather than waiting for the inventory to drop and then reacting with an extra shipment, they proactively add replacement kits to the next planned order. Whether this makes economic sense depends on the cost structure: adding kits to an existing shipment is almost always cheaper than triggering a separate emergency resupply.
Multi-factor uncertainty models: Some systems attempt to model correlated uncertainty sources more explicitly, not just dose titration, but randomization probabilities, stratification imbalances, dropout rates, and visit timing variability. This can yield tighter predictions when the models are well-calibrated, but adds complexity and requires ongoing validation.
Because these capabilities vary significantly between RTSM vendors and are often proprietary, we do not attempt to simulate them in the interactive guide. The key takeaway is that advanced predictive algorithms represent a spectrum of sophistication, and the right level of complexity depends on the trial’s characteristics, the drug’s cost and availability, and the team’s capacity to configure and maintain the system.
Where This Is Heading: Machine Learning and Delegated Replenishment
Two developments are worth watching, particularly for larger organizations running many studies at once.
The first is machine learning applied to site-level resupply prediction. Rather than relying on a handful of configured parameters, these approaches learn from patterns across a sponsor’s portfolio: how sites in a given country actually enroll versus plan, which protocols produce the most titration, how transit times really behave on specific lanes. The appeal is that a large sponsor has exactly the kind of cross-study history that a single trial lacks. The caution is the same one that applies to any learned model in a regulated setting: it has to be explainable enough to defend, and validated against the reality that every protocol is somewhat new.
The second is delegating site-level replenishment to a dedicated forecasting engine, where the RTSM supports it. A standard resupply algorithm gives you a few controls: buffers, windows, thresholds. A forecasting engine can consider far more, including the full enrollment plan, expiry profiles across lots, depot constraints, shipping costs and lead times per lane, and it can test configurations against simulated futures before committing to one. If your RTSM can accept externally calculated resupply instructions, there is considerably more optimization available than a handful of parameters can express. Neither of these replaces understanding the underlying algorithms. They change where the decision is made, not what the decision is about.
Custom Resupply Algorithms
Some RTSM providers and eClinical software/services offer custom resupply algorithms tailored to very specific trial designs, therapy areas, phases, or protocol considerations. These can theoretically produce better results than standard algorithms because they are purpose-built for the trial’s unique characteristics.
However, the trade-offs are significant. Custom algorithms require the study team to be more involved than usual during study setup, often as part of the User Requirements Specification (URS), calling for the vetting of new or unfamiliar configurations or system features. Due to their custom nature and/or relative novelty, study teams need to validate their reliability and ensure they are built to the trial’s specifications. This requires greater input from stakeholders, and the process is more time-consuming.
Custom resupply algorithms are also riskier to update as the trial progresses, creating uncertainty and stress not encountered with traditional, well-understood algorithms. In most cases, it is preferable to use a well-parameterized standard algorithm (one that is either smart enough on its own or can be automatically tested across different configurations) rather than investing in a bespoke solution that is harder to validate and maintain.
While custom solutions may produce savings over tried-and-true resupply methods, in this case the devil you know is often better than the devil you do not.
Algorithm Comparison at a Glance
Min-Max: Low complexity. Risk: medium-high
Best for unpredictable demand and early-phase trials
Needs two numbers and periodic review. Typical inventory overage: highPure Predictive: Medium-high complexity. Risk: low-medium
Best for stable enrollment with known visit schedules
Needs accurate, current visit and dose data. Typical inventory overage: lowHybrid / Standard Combined: Medium complexity. Risk: low-medium
Best for most trials with varying patient predictability
Needs the same current data, plus buffer settings. Typical inventory overage: mediumAdvanced Predictive: High complexity. Risk: low
Best for high-enrollment trials with expensive drugs
Vendor-specific inputs, may include enrollment forecasts. Typical inventory overage: very lowCustom: Very high complexity. Risk and inventory overage: variable
Best for very specific trial designs
Trial-specific inputs
Want to see how these algorithms perform side-by-side on the same patient demand? Our interactive RTSM resupply simulator runs all four against a 60-day Monte Carlo simulation and shows live KPIs for each: average shipments, kits shipped, stockout days, expected missed units, and wasted kits.
Forecasting Can Help You Choose and Configure Your Resupply Algorithms
A sharp contrast from custom algorithms is the ability for clinical supply forecasting software to empower the end user to choose what works for them. Using sophisticated mathematical modeling, dedicated forecasting and optimization tools for your trials can allow you to compare the efficiency of different parameters. You can optimize for service level, waste, shipments, or overall cost of your supply chain.
Rather than locking yourself into a single algorithm and hoping for the best, forecasting tools let you simulate how different configurations would perform against your trial’s specific characteristics, before a single kit is shipped. This means you can test whether a min-max setup with certain thresholds would outperform a hybrid configuration, or whether tightening your predictive window would reduce shipments without increasing risk.
This is especially powerful when combined with actual data from your RTSM as the trial progresses. By comparing forecasts against actuals, you can identify when your current configuration is drifting from optimal and make adjustments proactively rather than reactively.
At Trialzen, we have extensive experience in the clinical supply chain optimization and forecasting space. Our modeling engine can simulate your RTSM’s resupply logic, compare configurations side-by-side, and quantify the impact on your KPIs, so you can make data-driven decisions about your resupply strategy rather than relying on rules of thumb.
Whether you are setting up a new study and deciding between algorithm types, or mid-trial and wondering if your min-max thresholds need adjusting, dedicated forecasting tools give you the visibility to act with confidence.
Key Takeaways
IRT/RTSM resupply algorithms are the engine of your clinical supply chain. The algorithm running in your RTSM directly controls how and when drug kits are shipped to sites, impacting cost, waste, and patient safety.
Commercial supply chain logic does not translate. Clinical trials face fundamentally different challenges: near-zero tolerance for stock-outs, little historical data, and high demand variability. Purpose-built algorithms are essential.
There is no “best” algorithm, only the best fit for your trial. Min-max is simple and reliable for unpredictable scenarios. Hybrid models balance safety and efficiency for most trials. Predictive and advanced predictive approaches can optimize further when you have the data to support them.
Configuration matters as much as the algorithm itself. Even within a given algorithm, the parameters you set (min/max thresholds, prediction windows, enrollment assumptions) will make or break your supply chain performance.
You do not have to guess. Clinical supply forecasting and optimization tools like Trialzen allow you to simulate, compare, and optimize your resupply configurations against your trial’s actual characteristics, reducing risk, cutting costs, and giving you control over your supply chain decisions. Try the interactive resupply simulator to see the algorithms compared in real time.
Quick answers
What is an RTSM resupply algorithm?
The rule inside an IRT or RTSM system that decides when a site gets more drug and how much. It compares Site Available Inventory against a threshold and releases a shipment when stock falls below it. Algorithms differ in how that threshold is set and whether it moves as the trial changes.
What is the difference between min-max and predictive resupply?
Min-max uses two fixed numbers: drop to the minimum, ship up to the maximum, regardless of how many patients the site has. Predictive reads the enrolled patients, their visits and their latest doses, and orders what that forecast implies. Min-max is easier to audit. Predictive adapts, but needs current, accurate data.
Which resupply algorithm do most RTSM systems use?
The hybrid, or standard combined: a predicted demand calculation with a fixed safety buffer on top. The reorder point moves as patients enroll and titrate, and the buffer covers what the forecast cannot see.
What is a DNC date in clinical supply?
Do-Not-Count: the date aging kits stop counting toward Site Available Inventory, though they are still at the site and still dispensable. Inventory appears to drop, which can trigger a shipment no patient demand caused. Do-Not-Dispense, later, is when they can no longer be given out.
What does SAI mean in an IRT system?
Site Available Inventory: available stock, plus quarantined stock, plus anything in transit to the site. It is what the algorithm compares against its threshold, so anything that changes SAI changes resupply behavior.
What are PD, CUD and UUD in clinical supply demand?
Three kinds of site demand. Predictable: stable patients, known dose, known schedule. Correlated unpredictable: the visit is known, the quantity is not, because the patient may titrate. Uncorrelated unpredictable: no signal at all, such as patients not yet enrolled, or damaged kits. Prediction covers the first two. Only a buffer covers the third.
Why do commercial supply chain algorithms not work for clinical trials?
Service levels are far higher, since a stock-out can mean a missed dose. Trials have little or no historical demand data, which commercial forecasting depends on. And commercial models assume smooth demand, which does not hold at single-site volumes.
How do you choose the right resupply algorithm for a trial?
There is no best algorithm, only the best fit. It depends on how predictable dosing is, how variable enrollment is, drug cost, transit time and how much overage you can absorb. Simulate the candidates against your own trial before shipping, rather than inheriting the vendor default.